I conducted the survey experiment on April 13, 2025, with a sample size of 1154, where I asked respondents to select between two policy options with 19 attributes randomized with replacement over 9 forced 17 choice tasks. Respondent selected their preferred policy depending on the joint distribution in order to calculate average marginal component effects on each policy attribute, as well asindividual marginal component effects for to understand coalition-building dynamics through an analysis of heterogeneous effects.
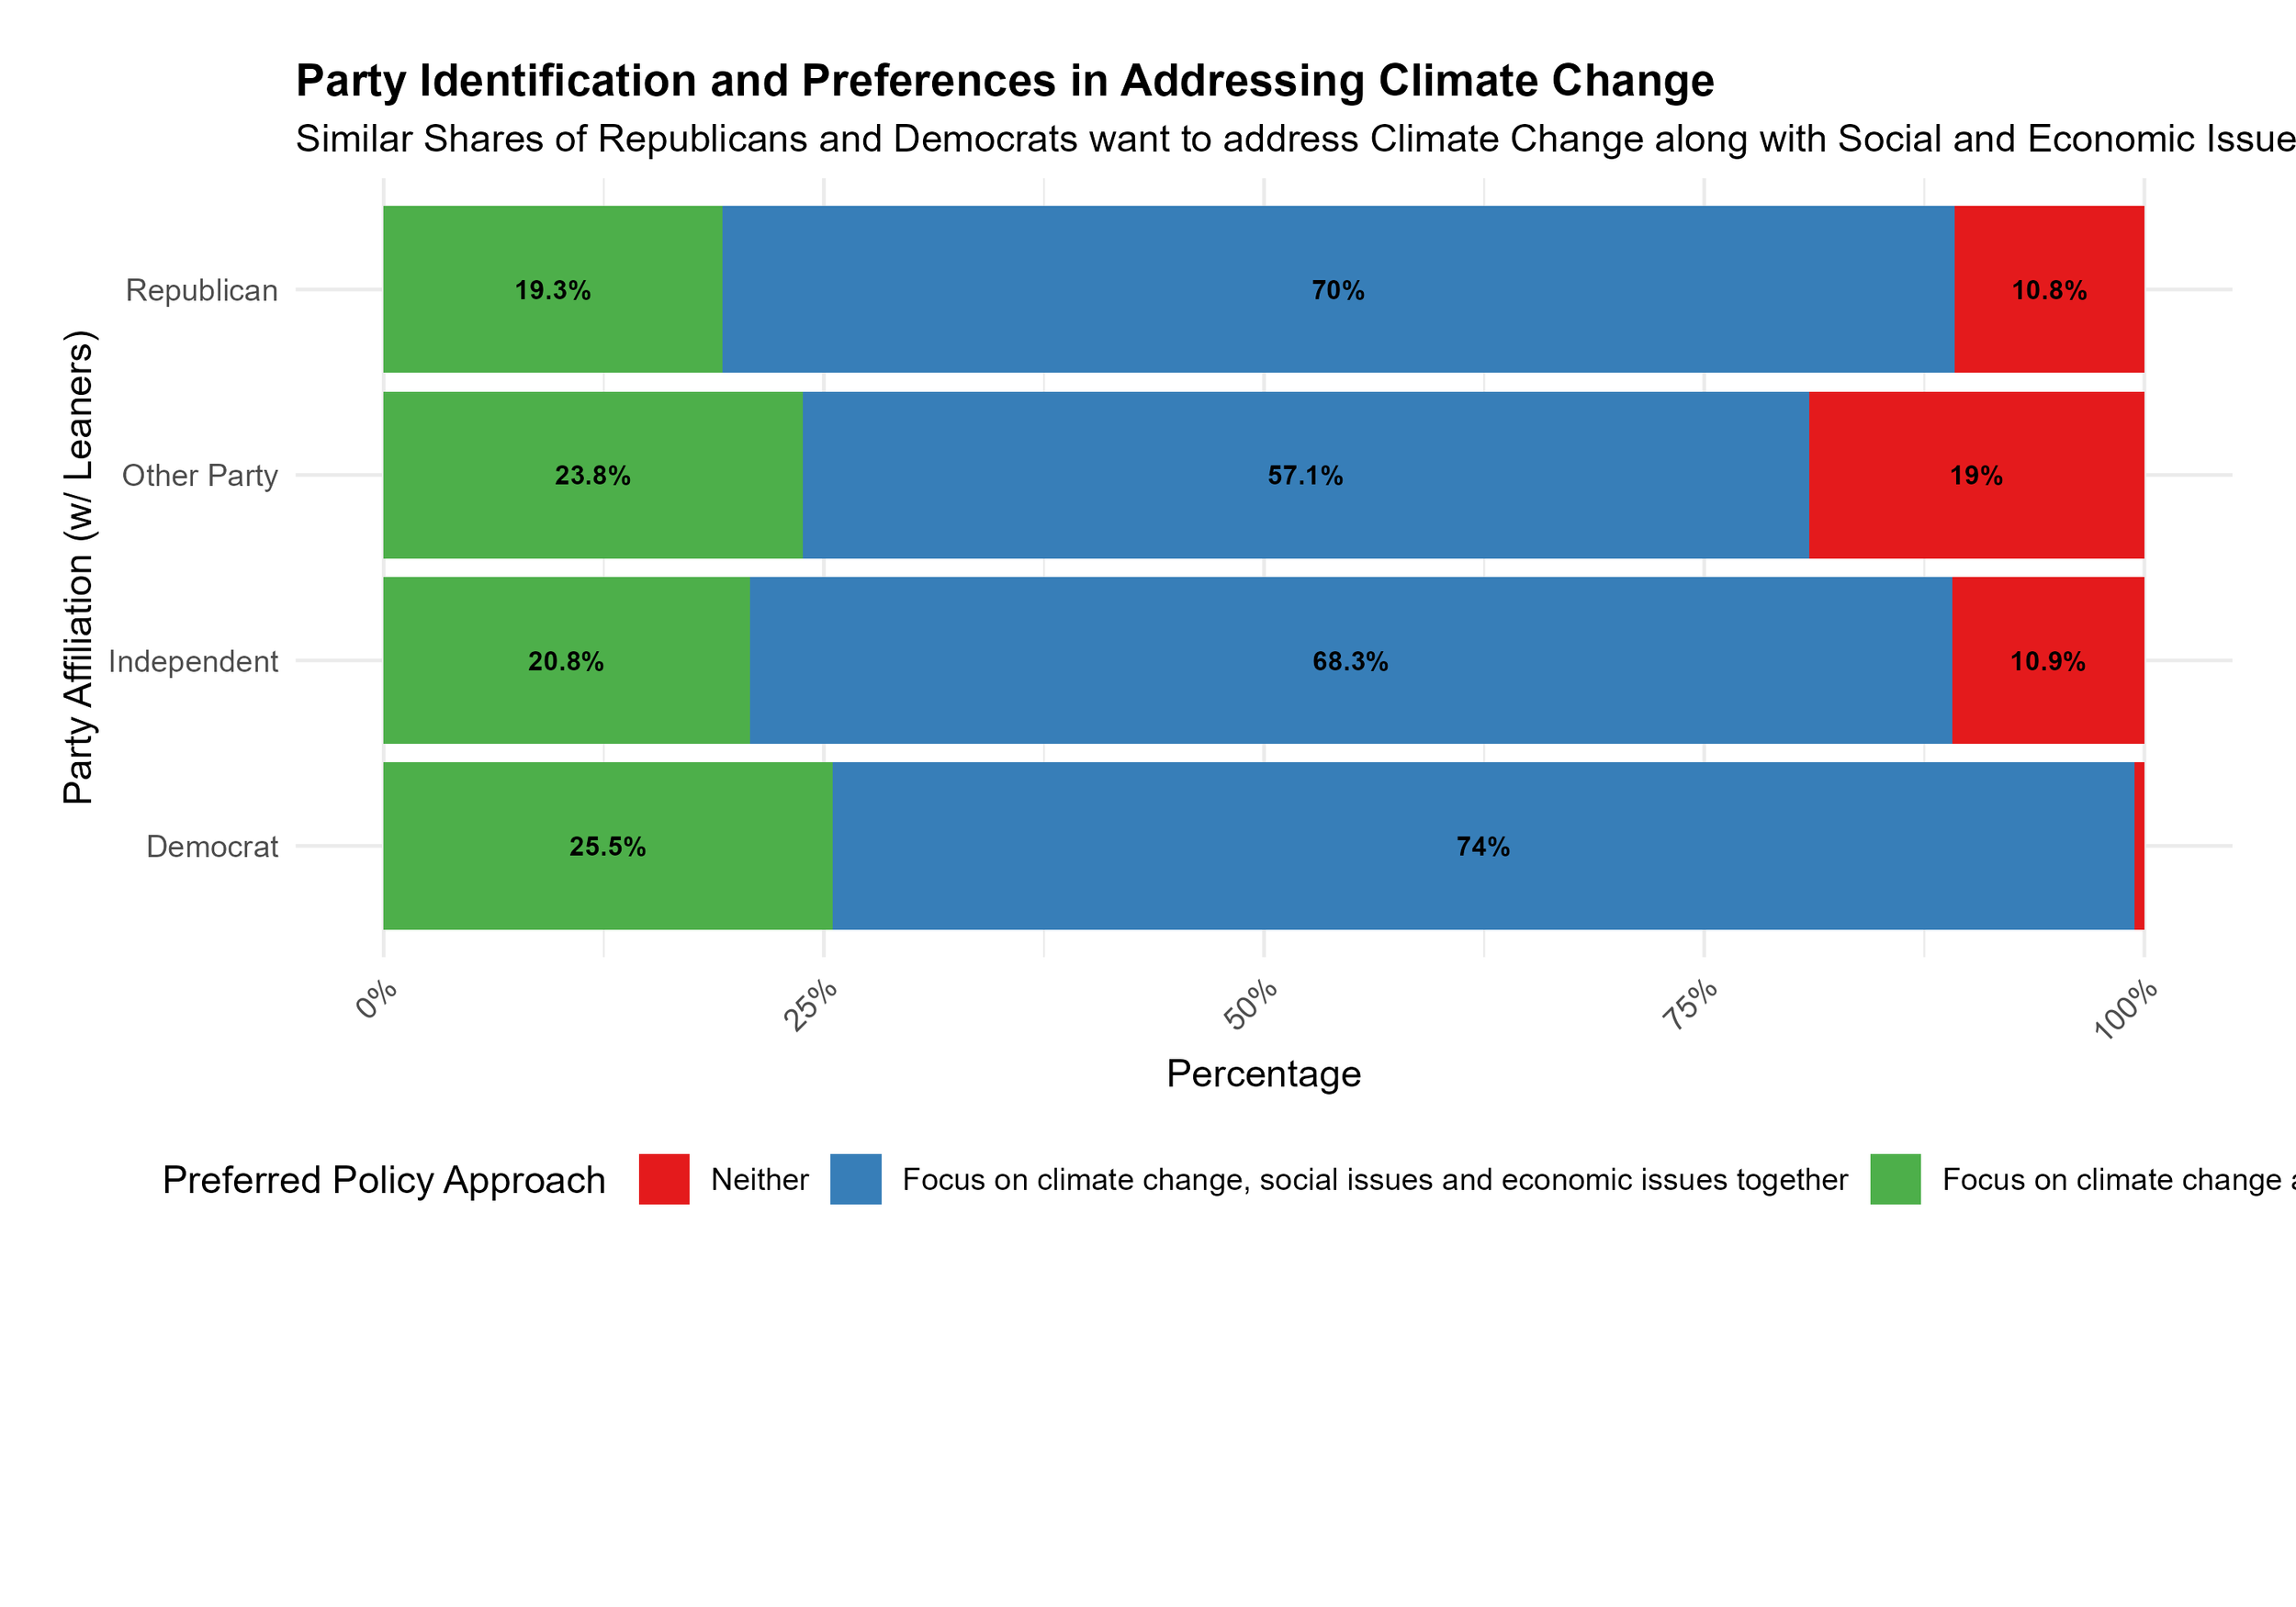
The sample shows overwhelming support for climate mitigation efforts. When asked whether policymakers should address climate change alone, alongside social and economic issues, or not at all, respondents favored a more comprehensive approach. Only 6.1% of the sample preferred no climate mitigation strategy compared to either a policy that singularly addresses climate change, or one that addresses climate change in conjunction with social and economic policies. The majority (71.4%) wanted climate change addressed together with social and economic concerns, while 22.4% preferred focusing on climate mitigation alone. While this question doesn’t specify which social or economic policies should accompany climate action, it reveals how climate-concerned respondents think about policy integration. In fact, a similar proportion of Republicans (70.7%) and Democrats (73.9%) favored combining climate policy with social and economic policy. However, of those who favor combining social and economic policies with climate mitigation policies, 49.5% are Democrats compared to only 35.2% who are Republicans.
Support for combining climate change policy with social and economic issues increases steadily with liberal ideology. Among liberals and the extremely liberal, over 76% preferred a combined approach, with nearly no respondents selecting “neither.” In contrast, conservatives were more divided: while a majority still favored the integrative approach (e.g., 69.6% of conservatives), 13.4% selected “neither,” and nearly 17% of extremely conservative respondents rejected both approaches. Moderates also showed strong support for policy integration (72.7%), though to a slightly lesser extent than liberals. These patterns suggest a clear ideological gradient in support for linking climate action with broader justice-oriented policies.
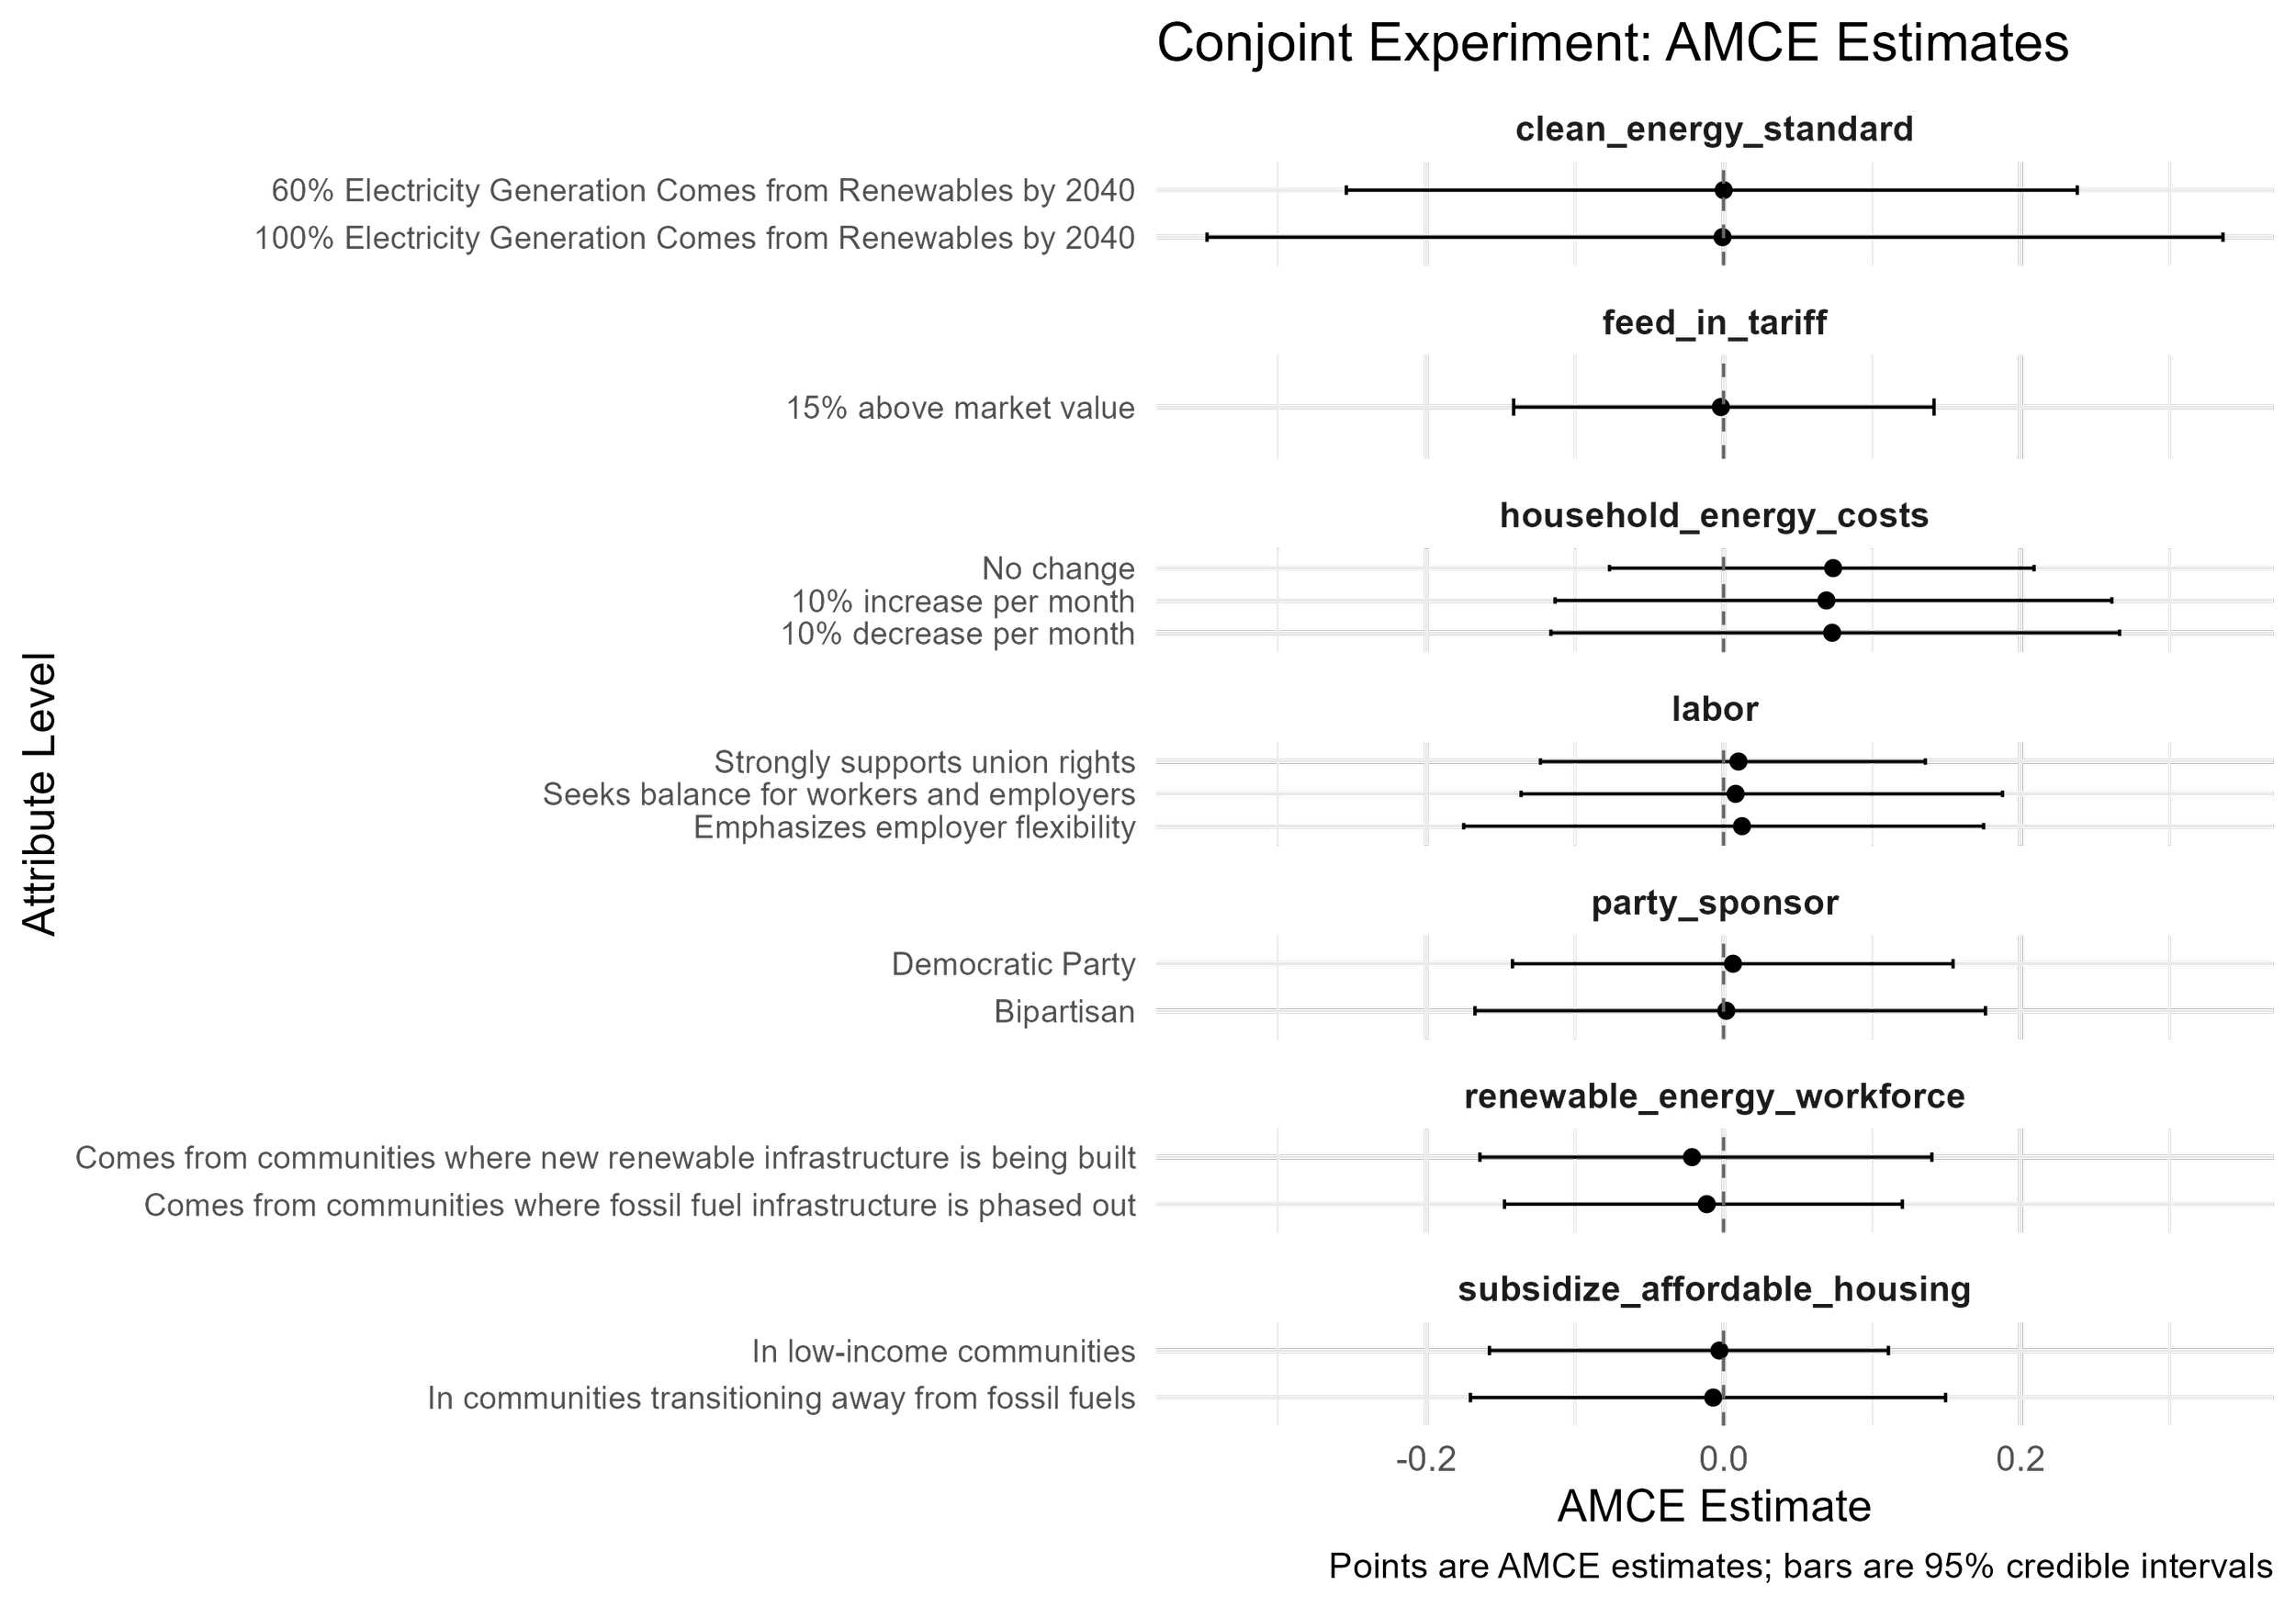
Although the majority of respondents expressed a preference for bundling social and economic policy with policy, I find no experimental evidence in the conjoint experiment that any particular policy drives increased support for climate mitigation policies for the sample as a whole. Broadly popular policies such as housing, labor, and workforce requirements do not increase the likelihood of policy adoption across the population (H1), nor does it do so while facing increased household energy costs (H2).The figure below presents AMCE results with fairly wide standard errors for nearly all policy areas.
Although this finding contradicts previous evidence found in Bergquist and Warshaw (2019) at the population level, estimates from conjoint experiments are only valid within the confines of the combined experimental estimand. In this experiment, for instance, linked policy attributes reflect the coalition-building structure as advocated by the Green New Deal, as discussed by scholars such as Bolet et al. (2023). However, because linked policy attributes contain a partisan valence, no policy attributes within the experiment were strong enough to drive adoption for mitigation efforts writ large. As a result, the notion that linking climate policy with any particular agenda tested within this conjoint experiment will drive overall support is unsupported by these experimental results. Rather, green industrial policies may require specific and strategic tradeoffs to maintain a coalition, rather than linking climate policy with other policy efforts, even if they are broadly popular.
Predicted Support for Climate Mitigation Policies by Group
These predicted probabilities come from the Yale Climate Change in the American Mind survey between 2008 and 2023 (n=33,265) controlling for age, gender, education, and income.
This image shows predicted support for climate mitigation policies when interacting with ideology and party. In general, we would expect respondents to become more opposed to climate mitigation policies the more conservative they are. Yet, this relationship varies substantially by party and across racial groups.
First, there is no overlap between Democrats and Republicans in supporting climate mitigation policies for white voters, but there is a fair amount of overlap in every other racial category. Republicans are less supportive than Democrats on average, but there is a fair amount of overlap for non-white voters compared to white voters. Democrats are the most supportive, and the racial groups differ mainly in how high or low the lines start, but they all display the same broad pattern of declining support with more conservative ideology. Those in the "other" category either choose "independent", "no party" or refused to answer, and have the lowest predicted support for climate mitigation policies. However, the more conservative their ideology, the more likely they are to support regulations, contrary to their peers in the two major parties.
Ideology is a strong predictor for support of climate mitigation policies for all racial groups, with the notable exception of Black Democrats, where support remains relatively low in comparison to other Democratic constituents. Ideology is a strong predictor of support for climate mitigation policies among Republicans compared to other parties, indicated by a steeper slope on average. However, Variance within Republican ideology as a predictor is also relatively higher compared to Democrats and those in the other category.
The upshot is that conventional thinking on partisan sorting on climate mitigation policies among the public is strongest among white respondents. Ideology and party affiliation remain salient for non-white voters but there is far more overlap between parties and across ideologies. These patterns should inform an analysis of potential coalition building for climate mitigation policies in the electorate.
Climate-Related Lobbying Over Time
This visualization tracks two measures of climate-related lobbying directed at Congress and federal agencies from 2008 to 2020. Using data from LobbyView, which documents lobbying activities reported under the Lobbying Disclosure Act of 1995, I analyze efforts by publicly traded companies through both the frequency of lobbying instances and estimated total expenditures. The data spans from the first quarter of fiscal year 2008 through the second quarter of fiscal year 2020.
Campaign Contributions to Each Political Party by Industry
This figure shows industry contributions to members of Congress by industry. This figure is based on contributions from PACs and individuals giving $200 or more from the oil and gas, utility, mining, waste management, and coal industries. All donations took place during the two years preceding each election year. The Federal Election Commission released figures for the most recent cycle on Monday, March 20, 2023.
Communities Facing Pollution Burden Compared to Designated Energy Communities under 48C Tax Credits
The upper figure shows the spatial distribution of pollution, and the census tracts that exceed thresholds for critical pollution metrics are marked in red, and other census tracts are in purple. Data comes from the Climate and Economic Justice Screening Tool (https://screeningtool.geoplatform.gov/en/methodology). The lower figure shows qualifying census tracts (red) for the Energy Project Tax Credit, known as the 48C tax credit. This IRA allocated$4 billion to projects that expand clean energy manufacturing, recycling, and critical mineral refining for projects that reduce greenhouse gas emissions at industrial facilities. In 2009, the first-ever round of 48C credits allocated$2.3 billion to nearly 200 clean energy manufacturing projects across 43 states.
Illegal Unreported and Unregulated Fishing
Illegal fishing, commonly known as Illegal Unreported and Unregulated (IUU) fishing, is a pervasive issue in global fisheries and international waters. It is estimated to account for approximately $23.5 billion in annual value, representing nearly a quarter of the total landed value of all fisheries worldwide (Agnew et al., 2009; Pauly et al., 2016). IUU fishing is linked to significant environmental degradation, including declines in fish populations, ecosystem damage, revenue loss, and food insecurity (Pascoe et al., 2008). Additionally, it is associated with transnational criminal activities, such as labor and human rights abuses, as well as various forms of drug, weapons, and human and wildlife trafficking (Kittinger et al., 2017). Despite being a major environmental challenge, IUU fishing has received limited attention from social science scholars, with most research focusing on environmental criminology.
This is a visualization I made as part of a working paper examining how conditions of scarcity affect illegal, unregulated, and unreported (IUU) fishing activity in varied institutional environments. This paper leverages the exogenous timing and geography of marine heatwaves (MHWs) to study the effects of climate-induced scarcity shocks on 1) illegal industrial-scale fishing behavior and 2) test whether institutional features mediate or exacerbate trends in IUU fishing. The sparse literature on IUU fishing indicates that weak state capacity contributes to IUU fishing but does not specify how different measures of state capacity, such as the ability to control territory and capacity for taxation, influence illicit behavior. Furthermore, this paper investigates how measures of levels of corporatism influence IUU fishing practices. By combining new data from Global Fishing Watch with anomalous sea surface temperature data, I investigate how different features of 1) states, 2) markets, and 3) ecological realities shape this IUU fishing under conditions of scarcity.
DC Heat Exposure and Sensitivity Index
This is mapping tool is designed to show the social and economic factors correlated with heat sensitivity and exposure. HSEI Data was gathered from Open Data DC and contains variables related to socioeconomic, health, and environmental metrics for DC's 206 census tracts.
DC Cooling Center Data When the temperature or heat index in the District reaches 95 degrees, the District Government, through the Department of Human Services (DHS) and the Homeland Security and Emergency Management Agency (HSEMA), will implement the Heat Emergency Plan and activate cooling centers for residents to seek relief. We provide locations, names of centers, phone numbers, and hours of cooling centers.
DC Tree Data DDOT's Urban Forestry Division (UFD) is the primary steward of Washington DC's ~170,000 public trees and has a mission of keeping this resource healthy, safe, & growing! Trees provide many benefits to the populations, such as improving air and water quality and creating habitat for local fauna. Importantly, trees are also critical for keeping the city cooler.
Data Sources:
HSEI Data: Open Data DC
DC Cooling Center Data: Open Data DC
DC Tree Data: Open Data DC
Contact: kv2717a@american.edu


